Inline Characterization
- During the production process, it is inevitable to encounter deposition errors. The accumulation of these errors can occur, which becomes particularly significant when dealing with a large number of layers.
- By utilizing taReo algorithms, it becomes possible to conduct inline characterization of multilayers composed of previously deposited layers. (see schematic in Fig. 1).
- The input information for the analysis comprises a multilayer design and the inline measurement data obtained after the deposition of each layer. Generally, this data is less noisy compared to the inline data flow, as the measurements are typically averaged.

Fig. 1. taReo building block inline characterization based on inline measurements recorded after deposition of each layer.
- Building block Inline Characterization (Fig. 1) can be used to characterize the deposited layers. As input, you need a multilayer design, layer and substrate materials. If measurement data recorded inline after the deposition of each layer are available, taReo can determine actual layer thicknesses. These actual thicknesses and errors in layer thicknesses can be used to correct deposition parameters (for example, tooling factors of quarts crystal monitoring or time-monitoring). Finally, actually deposited design layers will be calculated.
taReo characterization algorithms
In the case of the TRIANGULAR algorithm:
Measurements related to all previously deposited layers are being used in calculations.
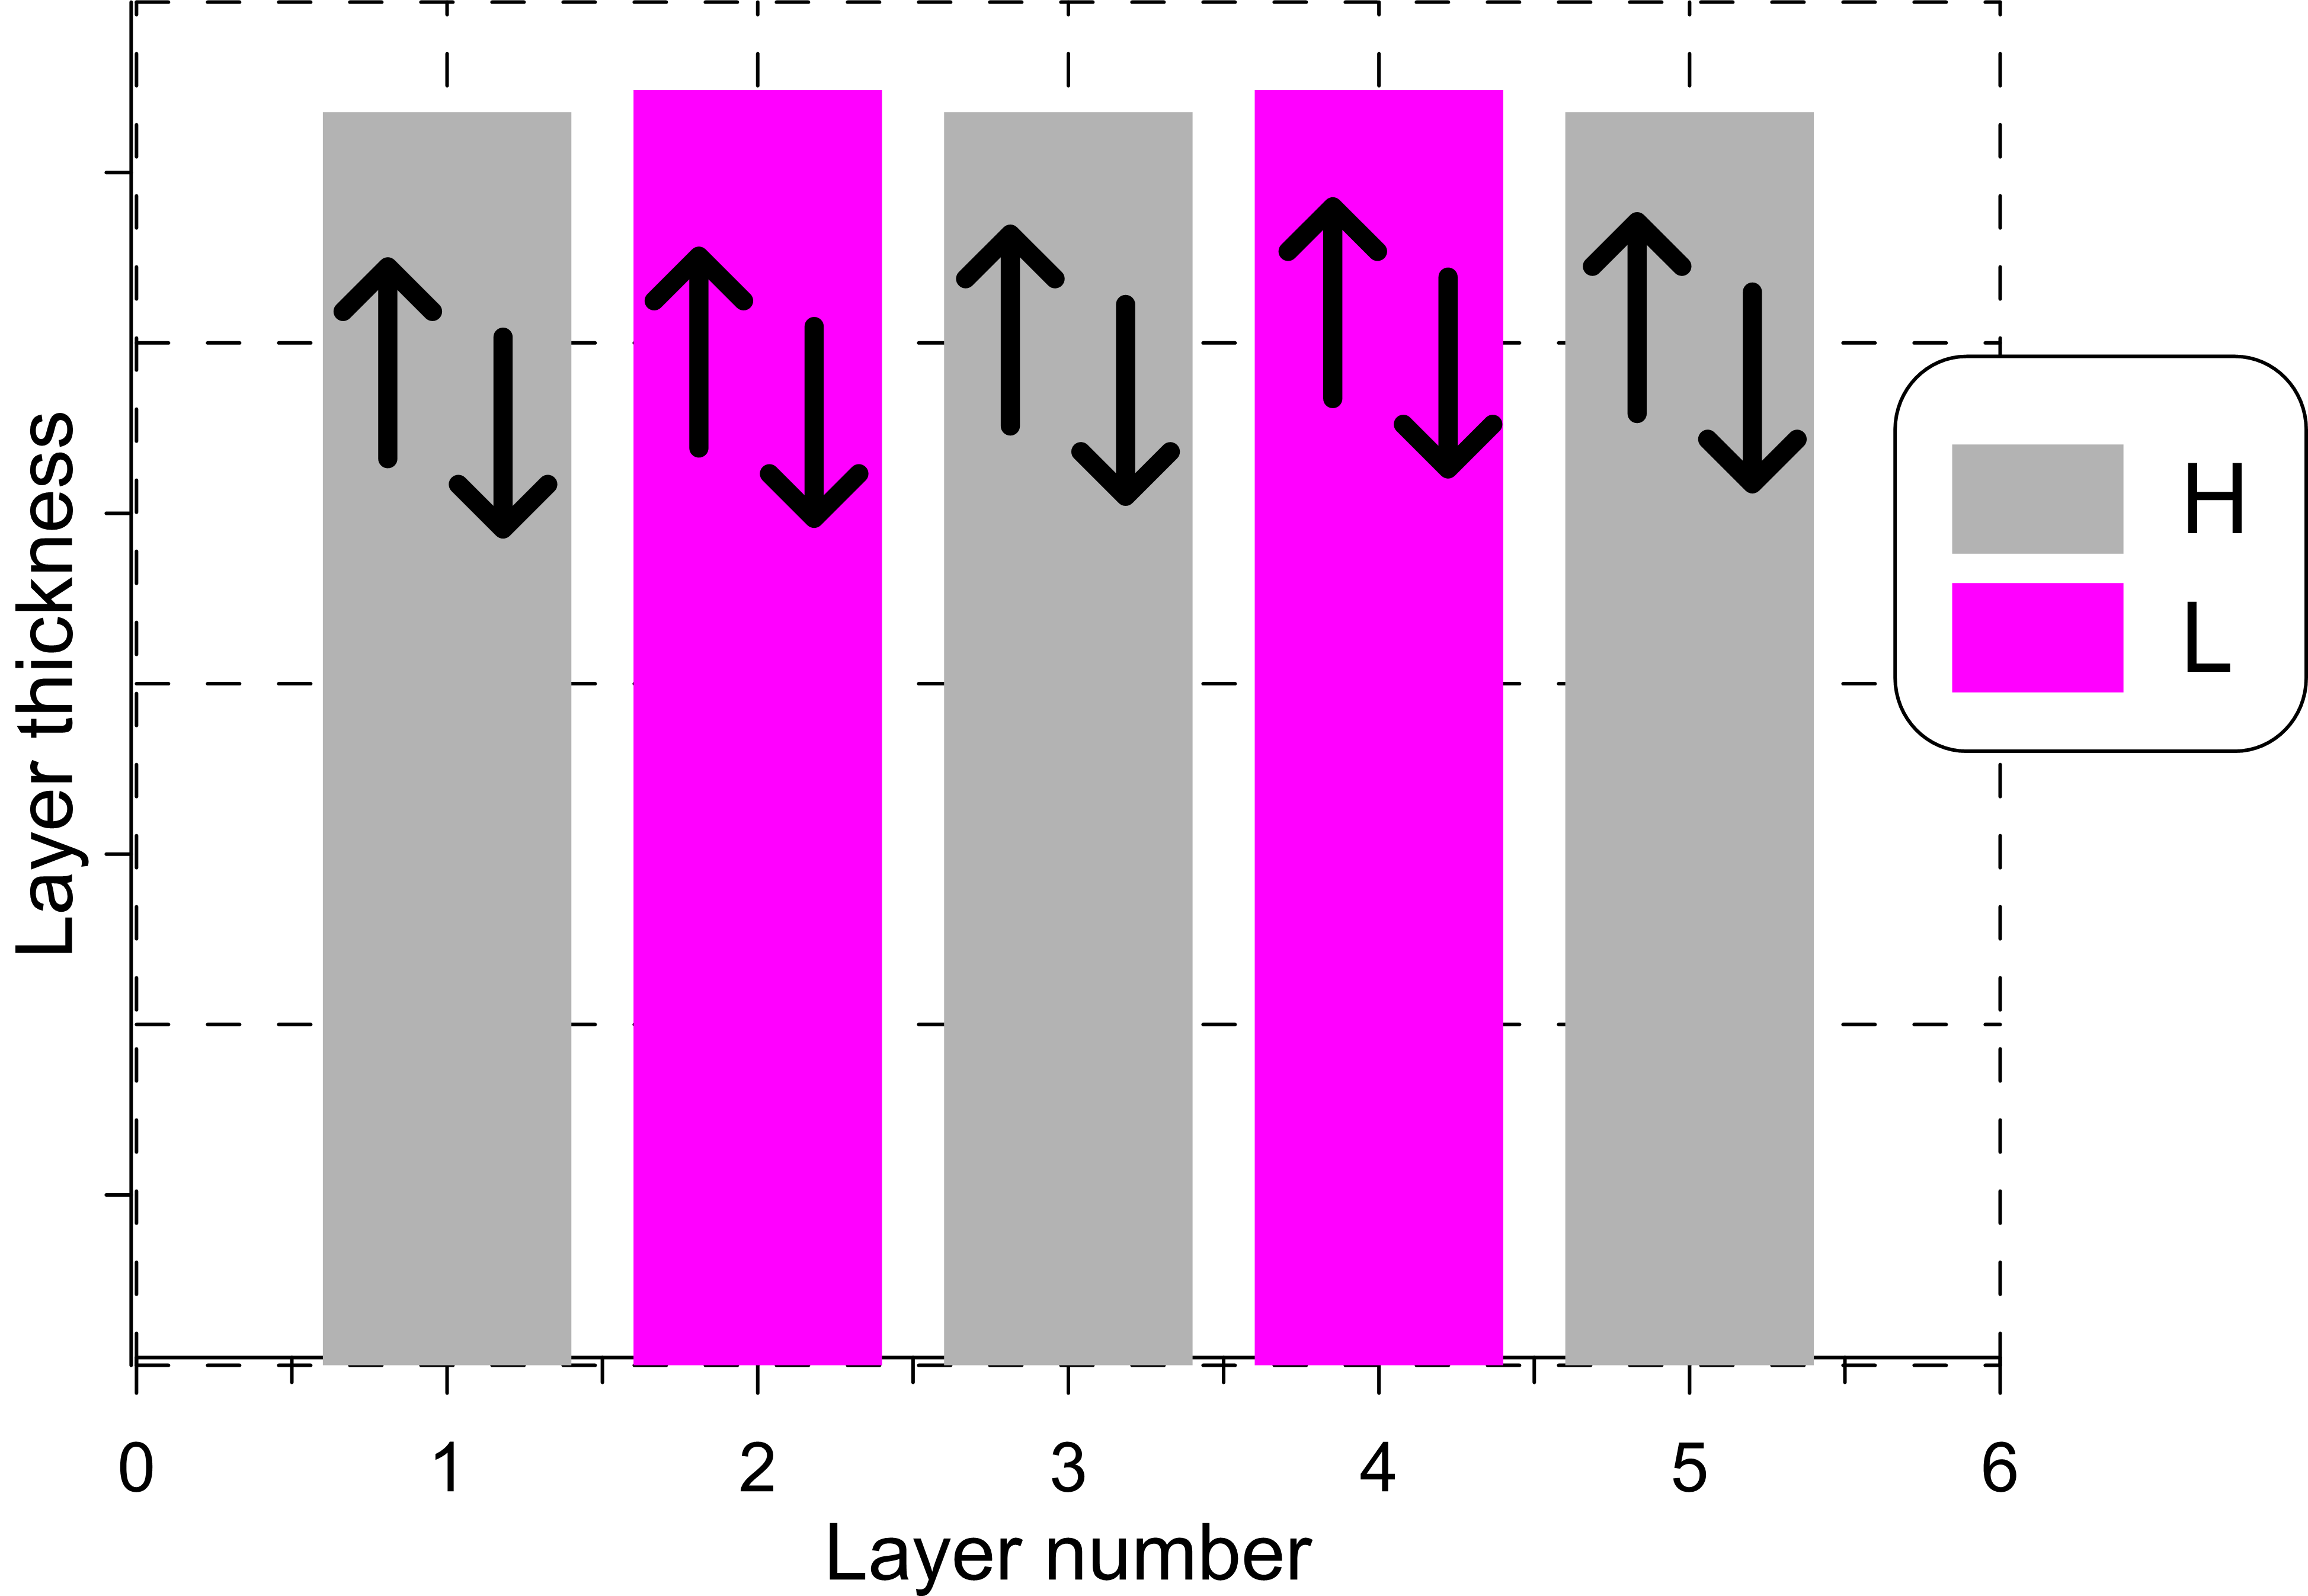
Thicknesses of the previously deposited layers are determined by the minimization of the discrepancy functions with respect to thicknesses of all previously deposited layers (Fig. 2):

Fig. 2. In the case of the triangular algorithm, all layer thicknesses are being determined in the course of the characterization process after deposition of each layer.
Generally, triangular algorithms provides more reliable thickness estimations of previously deposited layers.
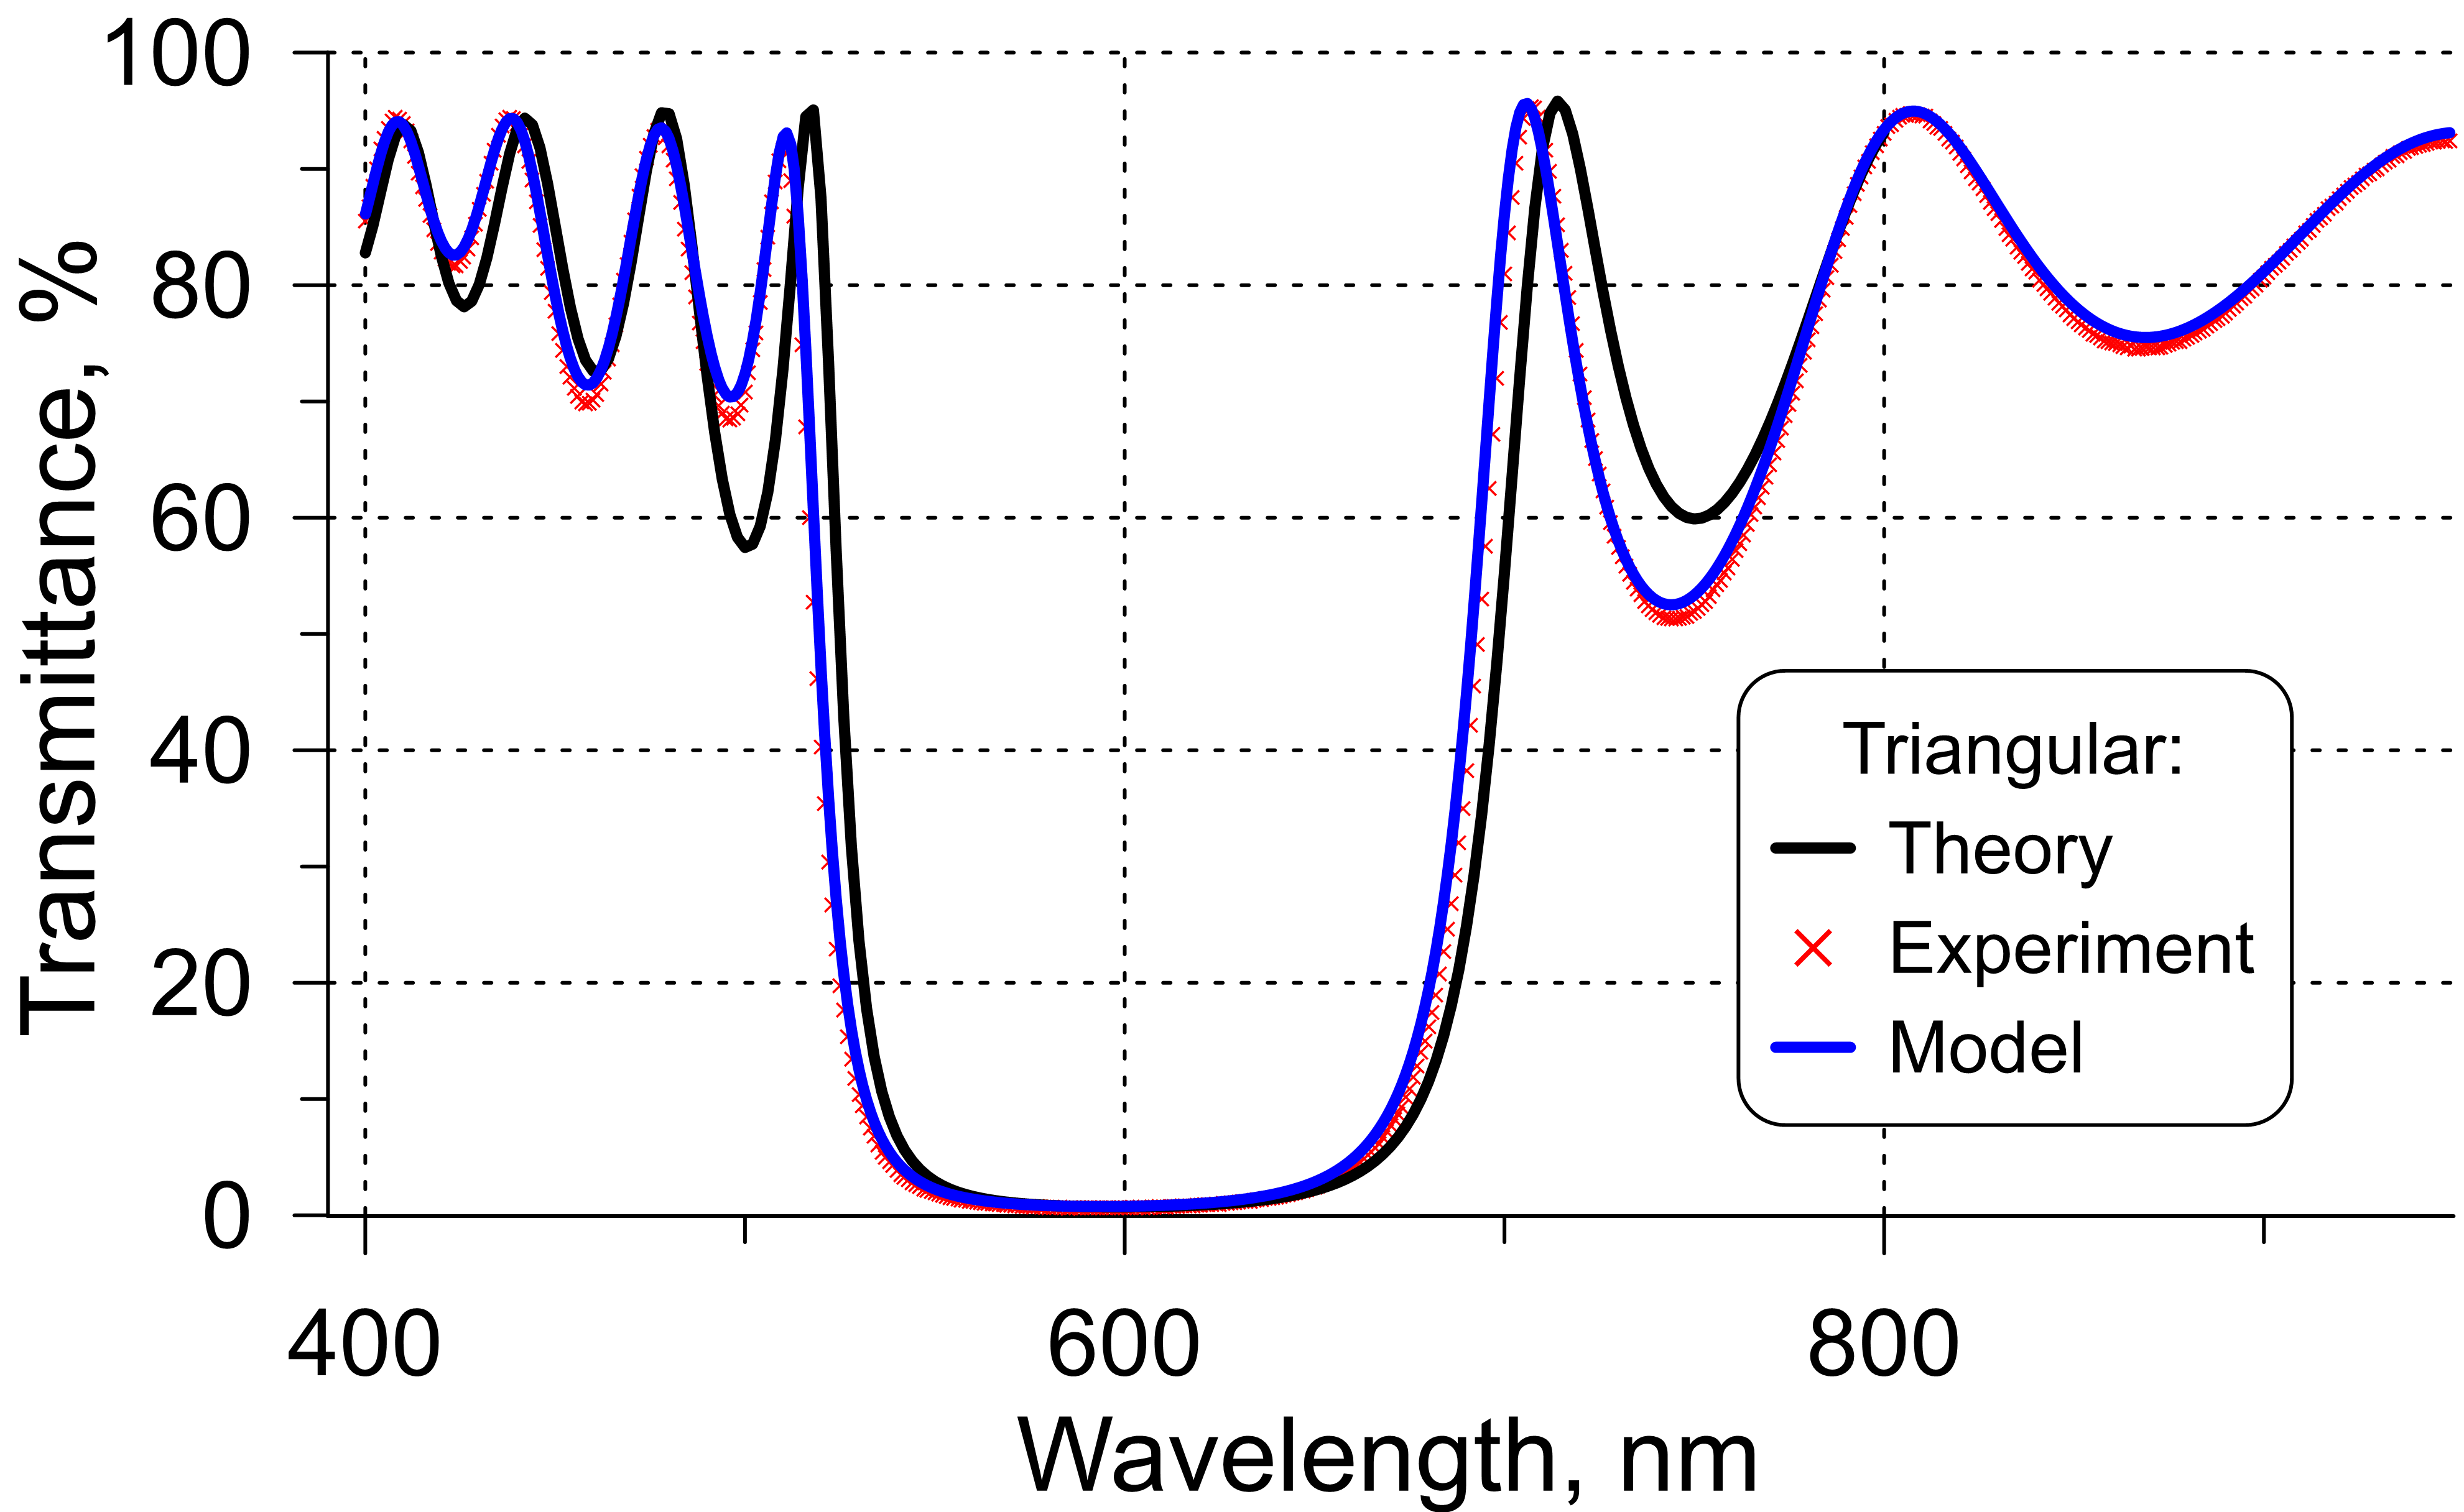
Example. Consider the production of a standard quarter-wave mirror designed for a central wavelength of 600 nm. In Figure 3, the theoretical transmittance is represented by the black curve. However, due to deposition errors, the experimental transmittance curve (depicted by red crosses) deviates significantly from the expected reflectance.
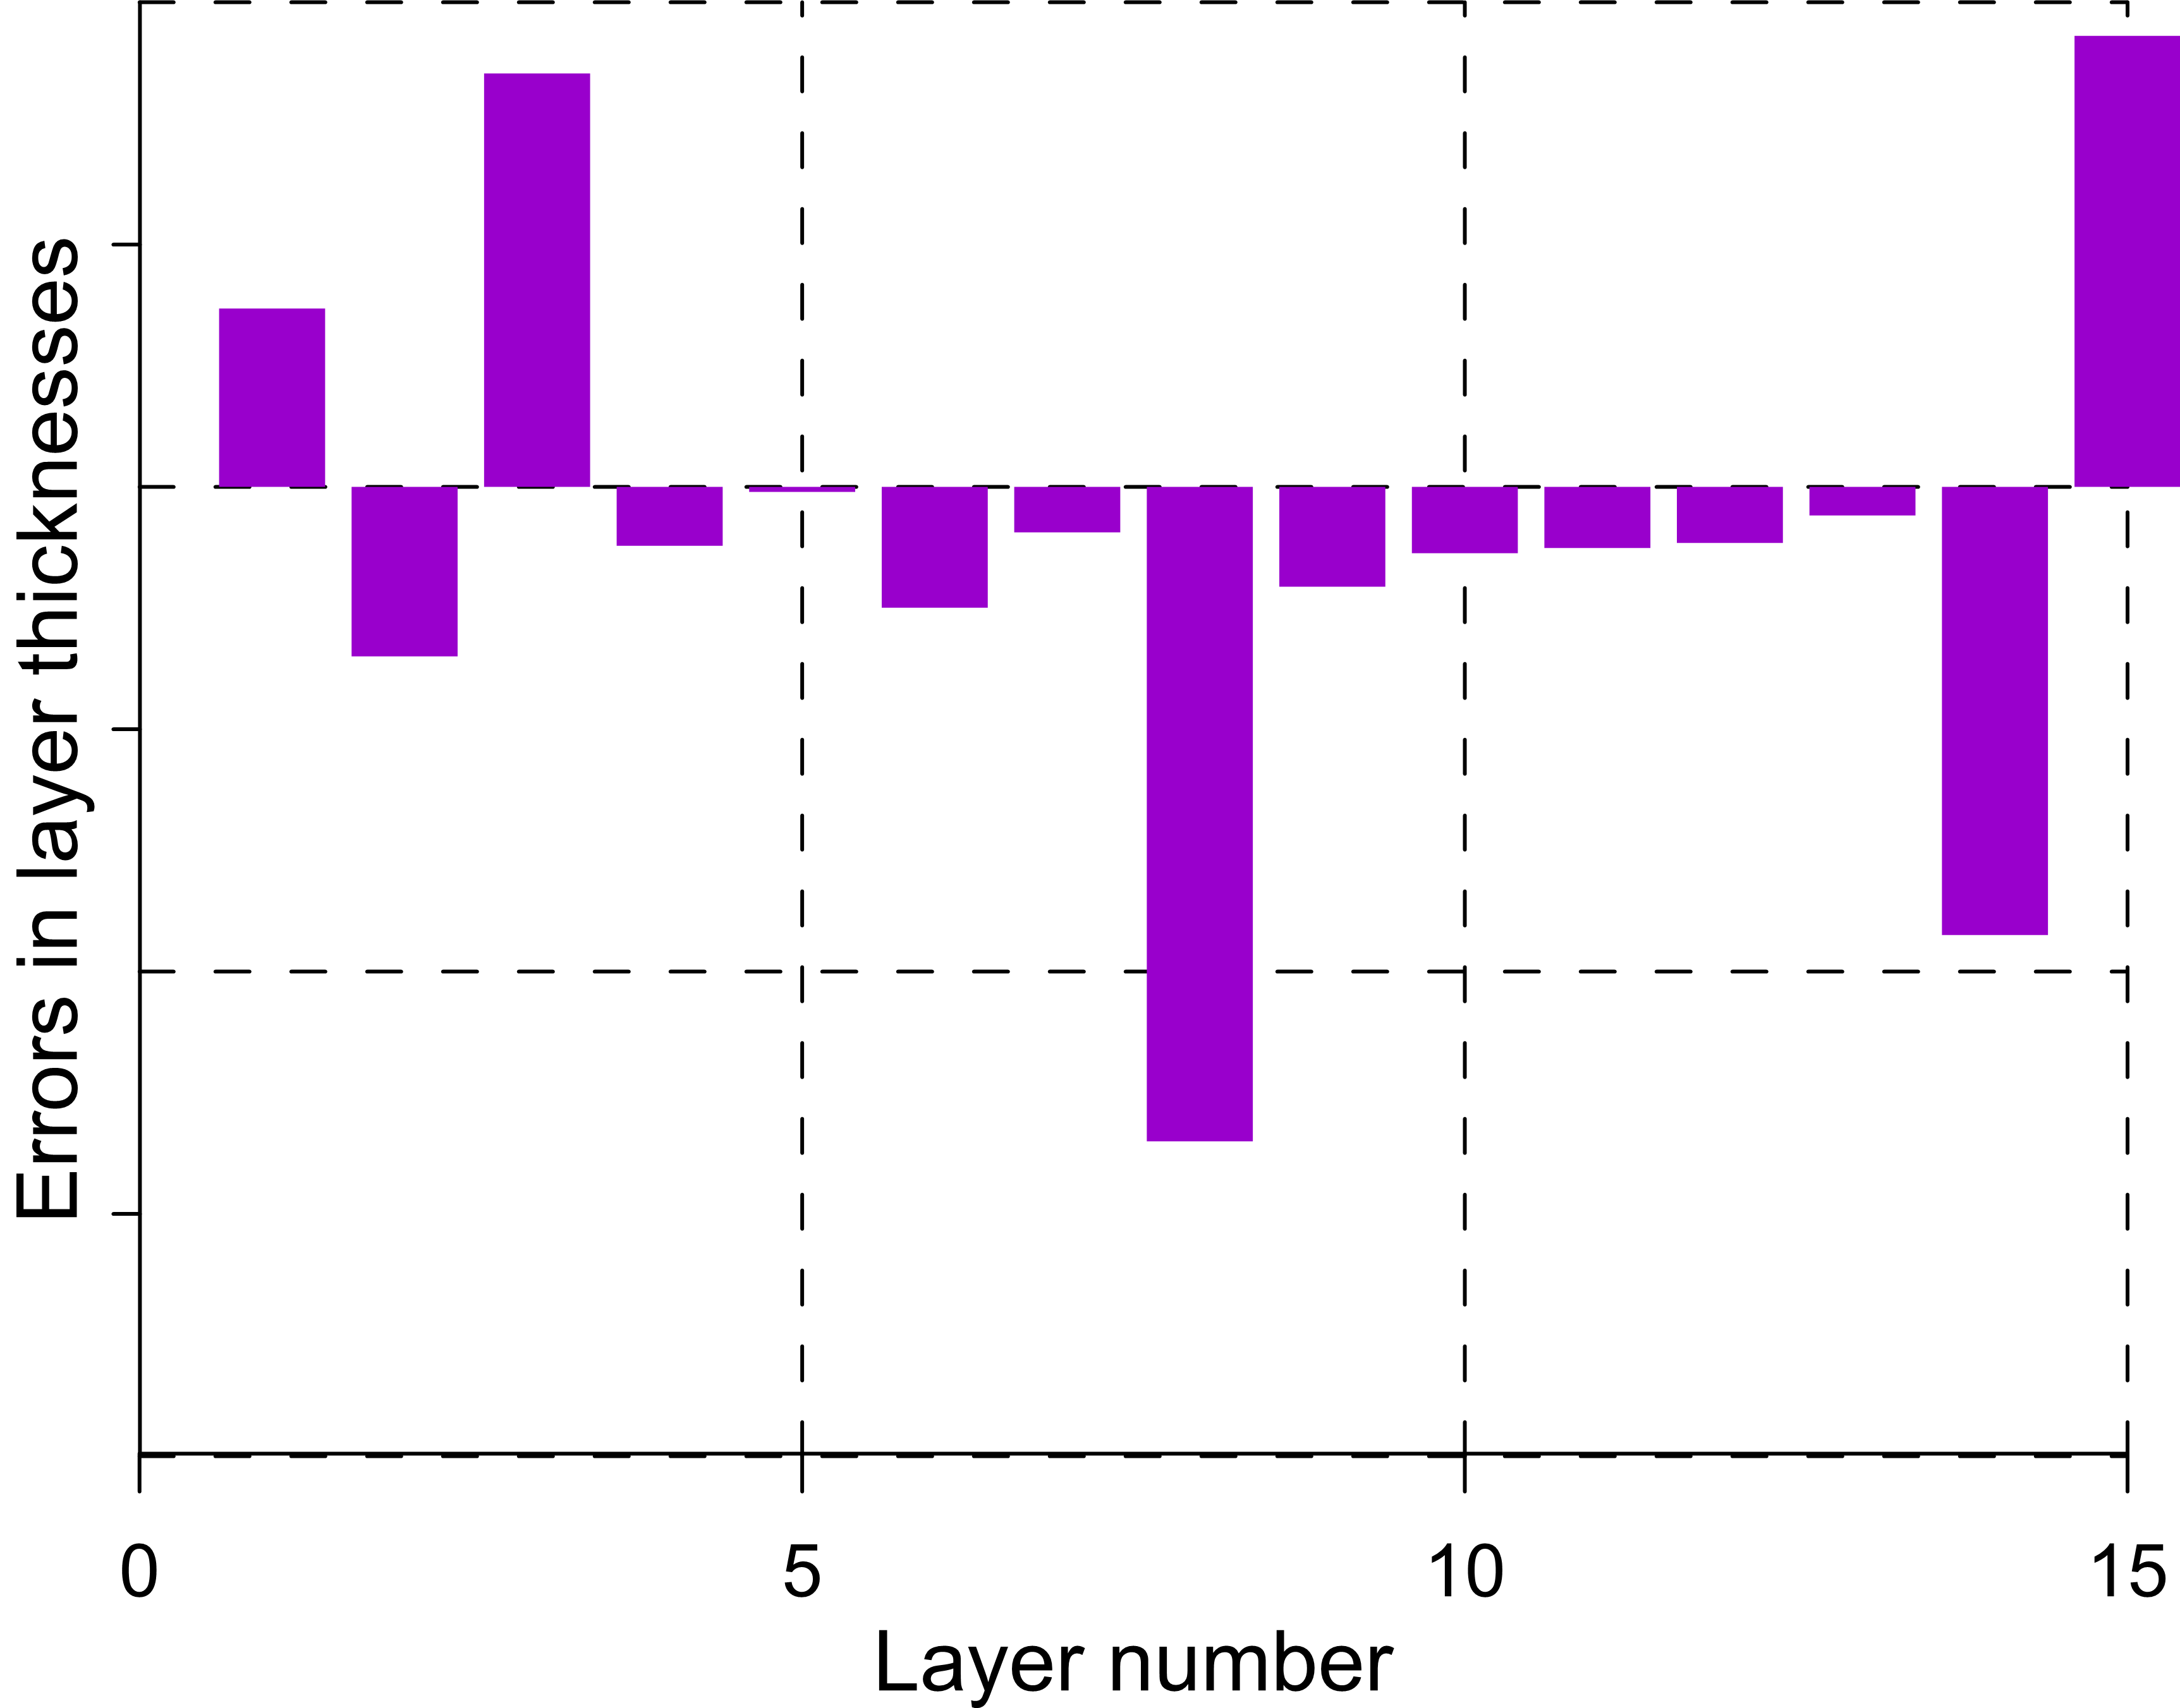
By utilizing taReo triangular algorithm with BBM data obtained after the deposition of each layer, it becomes feasible to accurately determine the errors in layer thicknesses (as shown in Fig. 4). The model transmittance, representing the transmittance of the coating considering these errors, is depicted by the blue curve in Fig. 3. The fitting of the experimental data with the model data (represented by the red crosses and blue curve) is excellent.

Fig. 3. Comparison of experimental data (red crosses) and theoretical transmittance (black curve). Blue curve represents model transmittance of the multilayer with thicknesses estimated using triangular algorithm.

Fig. 4. Errors obtained with the help of triangular algorithm.
How on-line characterization results can be used? Several suggestions:
- Systematic errors determined based on the on-line characterization of the first layers (for example, 8-10 layers), it is possible to interrupt the process and correct tooling factors or other deposition parameters. In the case, if random errors model were determined, taReo extract systematic errors part automatically.
- The deposition process can be interrupted, determined actual layer thicknesses can be fixed, and re-optimization of the rest layers can be performed. The remaining layers can undergo re-optimization based on the fixed thicknesses. The re-optimized design can then be deposited further, ensuring improved accuracy and performance in the coating.
- On-line characterization results can be used in combination with reoptimization of the remaining layers.


